Monday, May 27, 2019

Counteract the Summer Slide - Become a More Proficient Galileo User


We are all familiar with the concept of summer slide in terms of regression of student skills during summer break. In fact, the U.S. Department of Education has a series of blog posts* regarding this topic as well as student resource suggestions such as NGA Kids** (National Gallery of Art) or a summer reading list offered from Study.com***. In this blog, we are going to turn the tables and look at it in the perspective of an educator. We will apply the concept of summer slide to educators and what can be done over the summer to become a more proficiency user of Galileo K-12 technology.

As summer time begins and you start planning, ask yourself some questions before you get started: How much time will you dedicate to this? What resources will you need? Do you have appropriate access or will you need specialized access? Are there continuing education credits available? 

Once you have set some goals, do little research to figure out what resources are available and how to begin exploring them in Galileo. A few resources that might help in your journey to becoming a more proficient user follows:  


  • ATI Professional Development Help Files: This will likely be your best resource as a user. The Galileo interface includes a direct link to Help Files (knowledge base) with step-by-step instructions that guide users through a variety of tasks, as well as links to pre-recorded video tutorials, quick reference guides, and user manuals.
  • Learning on Demand:  Learning on Demand sessions are webinars that guide educators in becoming proficient users of Galileo K-12 technology with the goal of enhancing student learning. The sessions are scheduled throughout the year, and a library of recorded sessions are available on a variety of topics to listen to at your convenience. The sessions can be found in the Help Files. Continuing professional development credit is offered for those who register and participate in the live session. 
  • ATI YouTube page: Galileo Tours and Did You Know videos series offer insight into the tools and capabilities of Galileo K-12. The videos dig deeper into the technology in a step-by-step format.
  • ATI Support web page: Technical support documentation offers guidelines to ensure a successful year of implementing Galileo. We highly recommend you frequent the System Requirements/Security page to ensure that your online testing plans are in sync with the system requirements and security recommendations. 
  • ATI web page: The ATI website offers materials that give a general overview and highlight specific features available in Galileo. Check out the Resources/Publications page where videos, FAQs, research briefs, and white papers can be found offering an in depth understanding the possibilities found in Galileo K-12. 

As you start to explore these resources and dig deeper into the knowledge base materials, we trust that they will ultimately better equip you to help your students and fulfill your educational goals. But don’t forget to enjoy your respite from the classroom. 

* Amatucci, D. (2014, March 4). Stopping the Summer Slide [Blog post]. https://blog.ed.gov/2014/03/stopping-the-summer-slide/
** National Gallery of Art (2018). National Kids Art Zone. https://www.nga.gov/education/kids.html
*** Johnson, A. (2017, July). Why is Summer Reading so Important for Kid’s Success [Blog post]? https://study.com/blog/why-is-summer-reading-so-important-for-kids-success.html 

Monday, May 20, 2019

3 Key Capabilities Supporting Powerful, Data-driven Decision Making


Empowering educators with the right tools is the key towards having a successful year in the classroom. In this blog we will walk through a few key capabilities found in a comprehensive assessment system that can have an immediate impact in your classroom and help students soar on their learning path.

Let’s start with what we know. Research tells us that if we implement reliable and valid formative and benchmark assessments as part of a comprehensive assessment system, the data generated will provide teachers the information needed to guide and adjust instruction. This data positively impacts a student’s learning trajectory if implemented with fidelity in the classroom. 

What does a reliable and valid comprehensive assessment system look like? The Galileo K-12 Online Comprehensive Assessment System offers research-based assessments built to comprehensively reflect the content and skills reflected in state and national standards. This ensures that assessments can provide relevant and sufficient information about student learning to support decisions about whether students are on track or at risk. These assessments are designed to screen, diagnose, and monitor students’ learning and to inform instruction in English language arts, mathematics, and science. Several pre-built assessments are available in Galileo K-12 Online: the ATI Comprehensive Benchmark Assessment Series aligned to state test blueprints and the ATI Formative Assessment Series that provides brief technology-enhanced quizzes aligned to each standard. 

The Galileo Online’s comprehensive system will provide educators 3 key capabilities supporting powerful, data-driven decision making.
  1. Universal screening capabilities. Educators can now give benchmark assessments to screen students for instructional placement at the beginning, middle, and end of each year. This allows teachers to evaluate students’ RTI tier designations three times a year. The Galileo K-12 assessment system automatically places students into the most relevant instruction for each student.
  2. Progress monitoring. Formative assessments offer ongoing progress monitoring to keep educators informed on how students are learning and growing throughout the school year. Standard gaps are identified for each student. Then teachers can assign standards-based tests for weekly or bi-weekly progress checks, or even create their own tests from a large formative item bank.
  3. Forecasting capabilities. Galileo K–12 has predictive capabilities built directly into the program allowing a district to load state or local test data into the system and receive almost immediate predictive state or local test performance data using the program’s benchmarks. Educators can see if their instruction is moving the needle towards proficiency, allowing them to make adjustments as needed.

This is just the tip of the ice berg of possibilities in Galileo K-12 Online. Other assessments that can impact your classroom and can be found in Galileo are the Dyslexia Screening Toolkit, adaptive placement tests, and college prep test designed to prepare student for test high-stakes tests formats. To learn more watch this brief video or for a personal guided demonstration to explore Galileo contact us today.

About our integration: Imagine Learning and Assessment Technology, Incorporated (ATI) have joined forces to offer an integrated comprehensive assessment system with the digital education curriculum giving educators more power to personalize instruction. This combination means that ATI’s flagship product, Galileo K-12, will be infused into Imagine Learning programs beginning with Imagine Language & Literacy for back to school 2019. Galileo K-12 will also be available as a stand-alone assessment solution.

Other resources:


Monday, May 6, 2019

The Benchmark Performance Levels Report Provides an In-Depth Analysis of Student Learning

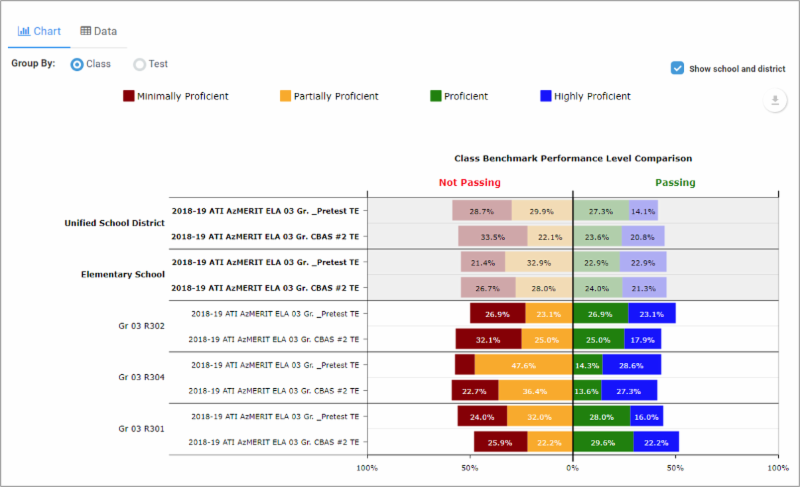
Check out the enhancements to the Benchmark Performance Levels report! It now provides teachers and administrators the capability to evaluate student performance on multiple measures involving classes and schools. This report is useful to answer the following questions:
  • which students need intervention?
  • which standards have students mastered? 
  • which standards should be retaught?
  • is student performance improving throughout the year?
  • how does class performance compare to school and district performance?
  • how does student performance compare across content areas?
  • which schools and classes are excelling or struggling?
  • how are students performing in each of their classes?

Compare performance across tests at multiple levels in the Benchmark Performance Levels report. 

The new report is accessible from the Benchmark Performance Levels report on the Teacher- and Admin Dashboards as well as from the Reports menu. Chart views include colorful bar graphs that illustrate patterns of performance. Data views provide interactive data tables that enable custom search and sorting. Additionally, print and export capabilities support a variety of formats such as JPG, PDF, and Excel.

Learn about additional reports found on the Galileo Dashboard.