Monday, December 28, 2009

A Closer Look at the Benchmark Results Page

When looking at the Benchmark Results page, which is the page that teachers generally go to when analyzing assessment results, you are encouraged to focus on the student’s Developmental Level (DL) or Scale Score rather than the student’s raw score.

This is because the DL score, and the student’s associated mastery level, provides a much better picture of a student’s ability. A raw score will simply tell a user what a student got right and what a student got wrong. The DL score factors in, not only what items a student got right and wrong, but also the difficulty and discrimination value (how well does this item discriminate between students of different ability levels) of the items.

When a student takes an ATI Benchmark Assessment, they will earn a particular DL score. A DL score is a score that takes the relative difficulty of the assessment into consideration. DL scores on two assessments can be compared in a meaningful way whereas raw scores cannot. For example, 70% correct on a very easy assessment does not mean the same thing as 70% correct on a very difficult assessment. However, a DL (scale) score of 954 on one assessment means the same thing as a DL score of 954 on another assessment, as long as the two assessments have been placed on the same scale. The particular DL score a student earns places them in a particular mastery category. Each state has its own mastery categories (Below the Standard/Unsatisfactory, Approaches the Standard/Partially Proficient, Meets the Standard/Proficient, Exceeds the Standard/Advanced) but they are similar in nature. For example:

Cut scores are then established to determine which Mastery category a student will be placed based on his or her performance on the assessment. The cut scores that define the mastery categories are established for Bencmark 1 using equipercentile equating to align students’ scores to their scores on last year’s state assessment results. The cut scores on all other assessments administered in a school year are established based on the amount of growth in terms of scale scores that is expected from one benchmark to another.

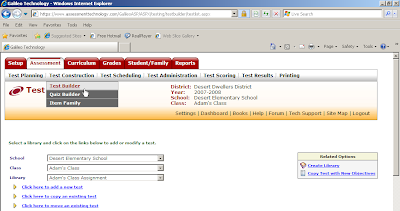
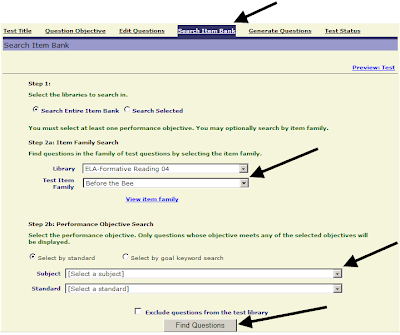
What does this mean for the user? Users can rely on DL scores and their associated mastery catagories, to help identify students to target for interventions, even after one benchmark assessment is given. A teacher’s goal should be to see an increse in DL scores (and mastery catagories) as the year progresses and students learn more of the standards. To acheive this goal, teachers will want to analyze the Class Development Profile Grid, Item Analysis and Risk-Level Report to identified standards on which to focus their re-teaching instruction. Click here to learn more about how these reports can assist with interventions.

Tuesday, December 22, 2009

Lesson Plan Documentation: A Great Use of Instructional Dialogs

Galileo Instructional Dialogs can serve as a unique recordkeeping tool for teacher documentation of which standards are covered during each teaching day as well as very detailed notes about the actual lessons or activities used in the classroom.

Start with a template Instructional Dialog with just the title on each slide. This Instructional Dialog may be created at the beginning of the year using whatever lesson plan format the teacher or the district advocates. Copy the template dialog.

Once the template is copied, fill in the blanks.

The lesson plan is preserved electronically and attached to a standard. The teacher only needs to view the resource in order to see the lesson plan.

A completed lesson plan in a different electronic format may also be attached as a resource.
Generate a short quiz at the end of the Instructional Dialog. This can check the effectiveness of the lesson.

Finally, schedule the dialog which will allow the Instructional Dialog/lesson plan to show up on Galileo’s class calendar for an effortless view of what has been accomplished in the classroom.

Thursday, December 17, 2009

Intervention Alert Report

The Intervention Alert Report is quickly becoming one of the more popular reports in Galileo. I have recently visited a number of districts and received positive feedback from many teachers. This report lists all of the learning standards on a given assessment and displays the percentage of students who have demonstrated mastery of the learning standards. Teachers can quickly identify which standards are not mastered since they are highlighted in red. This allows the users to easily identify standards to address during interventions. ATI has recently enhanced this report by listing the performance band (i.e., meets standard, approaches standard…) within each cell. It also gives the teacher information on how students performed on each standard at the school and the district levels. In addition to teachers, principals and district administrators can run this report at a school or district level. This is an actionable report that allows the user to schedule Assignments or use Quiz Builder, or drill-down through the data to view individual Student Results. It is available in the Reports area for district-, center-, and class-level users. It may also be accessed from the class dashboard page.

Tuesday, December 8, 2009

Thoughts on Race to the Top: Collaboration and local control

By now, grant applications for the federal Race to the Top (RTT) program are in preparation across the country. There are a lot of state department of education employees who are likely to have a hardworking holiday season as applications for the first wave of funding are due in January. With the 4.3 billion dollars that has been allocated, states will have significant resources that can be brought to bear to make the kind of sweeping and dramatic updates and changes to school systems that are called for as part of this federal initiative.

The guidelines presented to the states to prepare their RTT applications contained two clear themes. On the one hand, state education initiatives are supposed to preserve the “flexibility and autonomy” of LEAs. There is clear recognition of the need for districts to be supported in their efforts to make decisions about curriculum assessments and other issues that are in the best interests of their staff and students. In addition to the call for local control there is also a clear mandate for collaboration. States are encouraged to adopt common standards and collaborate to produce common assessments. One of the questions that state governments face in their preparation of their proposals is how best to balance these two, at times seemingly contradictory, objectives.

One of the ways that collaboration could be facilitated, while at the same time preserving the decision making power of the districts is for the state to make available to districts an item bank in which all of the items are on the same scale. These items could be used on both district interim assessments and the state test. What would this mean for the sake of districts you ask? Such an item bank would afford the opportunity to make sure that the assessments composed of these items, either entirely or in part, can be placed on the same scale. This means that the scores are directly comparable. The 500 on the math test given in the middle of the year could be compared directly to the 550 on the state test at the end of the year. Put another way, in this case, the statement could be made that the ability level required to achieve 550 on the benchmark test is higher than the ability level required to achieve 500 on the state test. Without tests that are on a common scale, such comparisons are not possible. The 550 might represent higher ability than the 500 and then again it might not. Having a common measuring stick could go a long way towards facilitating collaborative work.

A common item bank could also greatly assist smaller districts in their efforts to implement valid and reliable interim assessments for the purpose of informing instruction. The utility of assessment results is greatly aided to the extent that they reflect the kids that actually attend the district schools and the instructional priorities of the district. Research has consistently shown that the items behave differently when students change or when instruction changes. Ongoing analysis of test behavior is critical to making sure results are reliable and valid for the kids with whom it will be used. Such analysis is difficult with districts that have only small numbers of kids. Having a common item bank from which to draw could make it much easier to do the necessary analyses to back up an assessment initiative with a small district.

Achieving these beneficial results does not require that both the state and district tests are comprised entirely of items from this bank. The only requirement is that they both contain a sample of items from the bank. This would leave the district free to include local items reflecting content which may not be of interest to other districts in the state. Easy communication and collaboration need not be sacrificed in order to continue to achieve the flexibility and autonomy that allows districts to make sure that instructional improvement systems meet their priorities.

Anyhow, I had best sign off at this point. This post is already rather lengthy. We would, as always, be interested in hearing the feedback of others about these ideas or about other topics.

Wednesday, November 11, 2009

Multimedia and Instructional Dialogs

The Assessment and Instructional Content Department has developed a wide variety of Instructional Dialogs in math, English language arts and science to offer teachers tools to assist in the instructional process. These Dialogs contain instructional approaches that address specific state standards or components of those standards that are necessary in the development of student achievement. To further enhance the learning experience, additional assets are being placed in the dialogs to offer expanded interactive and engaging opportunities to learn.

One of the Dialogs benefitting from the advantages of multimedia technologies present in Galileo Online’s K-12 Instructional Dialogs is Chemical and Physical Properties of Matter, which focuses on middle school standards in science involving the properties of matter and the changes in those properties.

In this Dialog, the students are instructed in the key concepts of density; boiling point; melting point; and solubility. Then on slide 13, they are able to access a short video that demonstrates how to use these physical properties to separate substances under lab conditions.

Please take a look and let us know what you think about the Dialog, and the video and how they can help your students understand this important standard better.

Elevating Student Achievement: What Works

There is widespread agreement that in order to continue to be competitive in the global society in which we live, we must elevate student achievement significantly beyond current levels. The current national commitment to elevating student achievement is apparent in the Federal Race to the Top initiative which commits over four billion dollars to the national effort to increase student achievement.

We have certainly not reached the point where we can say that we have solved the problem of how to significantly increase student achievement. We will not be able to make that claim until the goal of increasing achievement has been realized. Yet, there is evidence regarding what works to elevate achievement. Moreover, the evidence suggests that the solution to the problem of elevating achievement can be rather straight forward.

There is evidence suggesting that one effective way to elevate student achievement is to administer a series of interim benchmark assessments aligned to academic standards and to the district curriculum and to use the results of each benchmark to re-teach the skills that students have not yet mastered. The Massachusetts Department of Education commissioned MAGI Services to conduct a study evaluating the use of ATI’s Galileo K-12 Online to elevate achievement. The study revealed that when teachers used Galileo benchmark assessments to guide instruction achievement was enhanced. This finding was not surprising to us. Nearly twenty years ago we conducted a study published in 1991 in the American Educational Research Journal that revealed findings consistent with those found in the MAGI Services study. We also note that for many years, WestEd has emphasized the importance of using interim assessments to guide instruction in its Local Accountability Professional Development Series. A number of “success stories” have also emerged that support re-teaching based on benchmark results. The remarkable success of the Vail Unified School District in Arizona is an example. Many other examples are beginning to emerge.

We believe that interim benchmark assessment can play an important role in elevating achievement in the years ahead. In this connection, we were delighted to find support for re-teaching utilizing interim benchmark assessment results and results from other assessments in the information provided in the Federal Register regarding the Race to the Top initiative. The Federal Register information on the Race to the Top program defines interim assessments, discusses the importance of establishing the reliability and validity of these assessments, and describes their use in guiding instructional decisions. A policy brief on the role of interim assessments in a comprehensive assessment system prepared jointly by the National Center for the Improvement of Educational Assessment and the Aspen Institute attests further to the growing recognition of the importance of interim benchmark assessments in guiding instructional decisions.

Given the straightforward nature of the approach and the growing body of evidence supporting its use, it would seem that jumping on the interim assessment bandwagon would not be a bad idea. We at ATI certainly agree. We have been developing interim benchmark assessments for use in guiding instruction for several years. However, deciding to use interim assessments to guide instruction is a bit like deciding to lose weight. It’s simple. Eat less, or if you want a complicated version, eat less and exercise more. Yet, losing weight is easier said than done. That is also the case with respect to using benchmark assessment to guide instruction.

Recently in a presentation to the Arizona Educational Research Organization (AERO), we initiated a discussion of the critical characteristics of interim benchmark assessments, the management technology needed to support an interim assessment initiative, the challenges associated with implementing such an initiative, and ways of addressing those challenges. You can find the presentation on our website. In the weeks and months ahead, we will be presenting success stories from a number of districts that will inform the discussion. The first of these recounts the remarkable achievements of the Laveen Elementary School District located in Laveen Arizona. This district achieved increases in the percentage of students meeting standards on the Arizona statewide test AIMS at every grade.

Stay tuned and give us your two cents. I know it’s not four billion dollars, but we still value it, and I am sure that the school districts meeting the challenge to elevate student achievement will value it too.

Monday, October 26, 2009

Creating A Secure Test Environment

As computer-based testing becomes more common and the students participating are increasingly computer-savvy, the security landscape changes. Where teachers used to be solely responsible for security, schools now ensure the integrity of tests with additional input from the district IS/IT department.

A secure testing environment can be created in a number of ways. The principles are similar to those applied to any classroom or lab with student-used computers – situations where access to the district LAN and Internet is limited and/or monitored. Many districts find that the creation of a secure testing environment relies on methods and tools already in place, with little modification.

The principles of creating a secure environment apply equally to an Internet-based or LAN-based testing scenario. If access to non-testing websites, servers, and applications is not restricted during the testing session, the opportunity to inappropriately access and/or share information is still present. A properly secured testing environment will achieve the desired result of ensuring accurate assessment of student knowledge whether the test server is accessed through the Internet or over the district LAN.

To read more about the principles of creating a secure testing environment, please go to http://www.ati-online.com/pdfs/SecureTestEnvironmentGuidelines.pdf.

Monday, October 12, 2009

Create Formative Assessments for ATI Item Families

Did you know that you can easily search ATI’s Formative Item Bank for items related to specific item families? An item family is a text or image to which test questions (items) may be attached. Galileo has libraries of item families that are linked to test questions.

Typically when a user builds a test in Galileo they do so by searching on specific learning standards to generate a test that assesses those particular standards. It is possible however to build a test by searching on an item family, reviewing all the questions linked to that item family, and selecting items to be on your test. Searching by item family is a benefit in that the process can be used to restrict the number of readings required for the measurement of specific standards of interest. Below you will find instructions on how to do this.

1. When you first log in, click on the Assessment tab in the red menu bar at the top of the page.

2.Click on the Test Builder link under Test Construction in the gray menu bar at the top of your screen.

3. Use the down arrow on the Class drop-down menu to select the class for which you would like to build a test.

4. Use the down arrow on the Library drop-down menu to select the library that will store the test you wish to build.

5. Click on the Click here to add a new test link. You will be brought to a new page.


Test Title Tab

6. Enter in your test title.

7. Select the grade level.

8. Click on the Save > button.

Search Item Banks for Test Items

With Galileo Online Test Builder you may search the item bank to find test items that articulate directly to the item families you have selected.

9. Click on the Search Item Bank link.

10. Select the Formative Library for the grade-level for which you wish to build a test.

11. Select an item family. You may preview this item family by clicking on the View Item family link. A pop-up window will appear that displays the item family in its entirety.

12. Click on the Find Questions button at the bottom of the screen. A list of test items that articulate to that item story will appear. Click in the checkbox of the test item(s) you would like to include on your test.

13. Click on the Add Questions to Test button.

14. You now have a test to give to students that focuses on an Item Family. Simply publish the Test and schedule it with students.


Test Status

15. Click on the Test Status link.

16. Select the Published phase by clicking on the radio button.

17. Determine if you would like this to be a Formative Test or Formative Protected Test.

18. To save your selection, click on the Save Test Status button.

Wednesday, October 7, 2009

Assessment Based on Instruction or the Benchmark Assessment Series?

Should students be assessed based only on instruction provided during the benchmark period or should all grade-level standards be assessed on each benchmark? This question is asked frequently by ATI clients.

ATI recommends that school districts assess students on standards targeted for instruction if:

· There is an established pacing guide. The school district has a relatively large number of students who will be taking each test. The school district has a pacing guide that includes instruction on all state-tested standards.

There are two particularly important benefits associated with the approach of aligning assessments with a pacing calendar: First, students are assessed only on material that they have been recently taught. Second, it is typically possible to include more items on each standard being assessed than would otherwise be the case. This increases the amount of information on student performance available for each standard that is assessed.

In contrast, when a school district has many different pacing guides, there are challenges associated with the attempt to align assessment with what is currently targeted for instruction. Disagreements about which standards should be assessed on which benchmarks tend to surface when teachers are not all on the same page. It is difficult to make decisions about which classrooms and pacing guides should take precedence over the others.

In addition, analyzing data and making predictions on how students will do on a high stakes tests is most effective when large numbers of students take an assessment. There is an adverse effect on the stability of item parameter estimates used in determining item difficulty, discrimination, and guessing. With many different pacing guides, the numbers of students taking each assessment decreases.

ATI offers an alternative for school districts that don’t have a widely used pacing guide in place or who would only have small number of students taking each assessment. The Benchmark Assessment Series assesses all grade level standards thereby providing Development Level information for students no matter what pacing guide their teachers are following, allows a greater number of students to take the same assessment, and will pinpoint areas where large groups of students have not mastered concepts which will be assessed on the state tests.

Monday, September 28, 2009

NEW Galileo Teacher Dashboard

As districts are nearing the end of the 1st quarter or semester, it’s likely they'll also administer benchmark assessments. Once the results have been scored in Galileo, teachers should become familiar with an exciting new enhancement called the Teacher Dashboard. The Teacher Dashboard page provides an area where teachers can track recent and upcoming events, such as assessments and dialogs for their classroom as well as test results (benchmark and formative assessments). One of the new reports that’s included on this screen is the Intervention Alert. This report displays the percentage of students who have met the standard on the standards/performance objectives from a particular test, giving you access to Quiz Builder and intervention assignments directly from the results page.


Wednesday, September 23, 2009

Reaching for Precision in the Imperfect World of Multiple Choice Items – It Begins with Item Specification Right from the Start

Multiple-choice questions are the most widely used approach to assessing student mastery of standards. In fact, they represent the largest proportion of item types on state-wide tests measuring standards mastery, on national tests measuring educational progress, on college entrance exams, and on benchmark and formative assessments utilized as part of local school district assessment programs. The information gleaned on student learning from this broad array of assessments is used by a diversity of educational decision-makers to accomplish a wide range of educational goals.

These goals may include: 1) re-teaching and enrichment intervention for a student, group, or class; 2) school- or district-wide proactive educational planning to help promote student mastery of standards throughout the school year; and 3) comprehensive strategic planning initiatives that may substantially alter the kinds of programs, policies, and practices implemented within a school district or throughout an entire state.

Given the extent to which assessment data can and does drive educational decision-making, it is imperative that the construction, review, certification, and empirical validation of multiple-choice items included on these assessments be very, very precise.

A typical multiple-choice item has three parts. These include a stem that presents a problem, the correct answer; and several distractors. These items can be constructed to assess a variety of learning outcomes, from simple recall of facts to highly complex cognitive skills.

Regardless of learning outcome being assessed, precision in the item writing process begins with precision in designing an item in such a way so as to ensure that the focus of the item is on the specification (i.e., the construct) being measured. In the ideal world of assessment students who correctly answer an item built in this fashion are assumed to do so because they have mastered the principle or construct being assessed. Of course, as we all know, the real world of assessment is an imperfect one, and one in which measurement is not always precise. Measurement error and guessing, for example are a permanent part of that real world.

That being said, we can take considerable steps right from the start in fostering a high level of precision in item development even in this imperfect world of assessment. For example, when new items are to be added to the ATI item banks for use in Galileo K-12, the first step is to review the standard which is to be assessed. The standard is broken down into the skills that make up the standard. These skills are the starting point for developing an online list of item specifications defining the characteristics of the particular class of items to be written.

Item specifications indicate the defining characteristics of the item class, the rationale for the class, and the required characteristics for each item component. In the case of multiple-choice items, the required characteristics of the stem and the alternatives are specified. Specifications address such factors as the cognitive complexity intended for items included in the specification, the appropriateness of vocabulary, requirements related to readability levels, and the alignment of the item with standards. The value of creating specifications as a guide for the item development process is recognized as a critical part of a process documenting that assessments are reliable and valid indicators of the ability they are intended to measure (Haladyna, 2004). Their structure and specificity also afford many advantages for ensuring that assessments may be readily adapted as district needs and or state/federal requirements change.

Extensive information about the ATI item specification process as well as the multi-stage item construction, review and certification procedures use by ATI can be accessed by contacting us directly.

We would, of course, like to hear from you as well. For example, what kinds of challenges have you faced in developing items within your district or for your classroom? And what kinds of solutions/procedures have you implemented to help enhance the precision with which locally developed test items are developed, reviewed and empirically validated?

Reference: Haladyna, T.M. (2004). Developing and Validating Multiple-Choice Test Items (3rd ed.). Mahwah, N.J.: Lawrence Erlbaum Associates.

Saturday, September 12, 2009

The Galileo Data Import Process

Many schools are welcoming students back from summer break. With returning students comes a new Galileo program year, accompanied by new class lists and rosters.

For those new to the process, the best way to create your class lists and rosters is through the Galileo Data Importation process. Through this process, districts provide an export from their Student Information System (SIS) that lists all classes, teachers, and students within the district. ATI staff then import this data directly into Galileo K-12 Online once the import has passed quality assurance. Instructions for the import process can be found in the Tech Support section of Galileo K-12 (and Preschool) Online, as well as at the following links:

Preschool: http://www.ati-online.com/pdfs/ImportInstructionsPre-K.pdf

K-12: http://www.ati-online.com/pdfs/ImportInstructionsK-12.pdf

As you prepare your 2009-2010 program year data for import, please remember the following important points:

1) Be sure to include all required information in your import.

2) Optional information is not required in the Galileo database, but failure to include this information may adversely affect filtering.

3) If TeacherID or StudentID fields change within your SIS, please notify ATI prior to providing any import files to ensure proper transition within the Galileo database.

Please refer to the links above for more details about the import process.

Monday, August 10, 2009

ATI offers a New Tool for Professional Development

This school year, users will see something new in the yellow user options menu. There is now a link to the Forum.


The Professional Development Forum provides Galileo users the opportunity to share their experiences, ask questions, and obtain Professional Development assistance from the experts at ATI. This is an electronic, user-driven discussion board. The goal for the Forum is to create an online community for educators, where ideas can be shared and support can be found.


When a Galileo user clicks on the forum link, they are brought to the discussion board where they peruse the topics listed. To actively participate in the forum, the user must register. Registering for the forum is accomplished with a few simple strokes of the keyboard and a click of a mouse.


Once users have registered for the Forum, they will see that it is divided into a number of categories such as Assessments, Data Management, Dialogs, and Reports. There is an ATI News category where you can learn about new features of Galileo and a section where you have an opportunity to provide ATI with suggestions for product development.


One of the most popular areas of the Forum is the Resource Library where users can download training manuals and Quick Reference Guides. In the Resource Library users will also find short video tutorials. These may be accessed and replayed as frequently as the user desires.

Join the Galileo Professional Development Forum today! We look forward to your participation.

Monday, August 3, 2009

ATI Custom Benchmark Assessments in Two Easy Steps

Time Line

It takes six to eight weeks to create a benchmark assessment. Leaving plenty of time will result in a great product. The first step is to submit assessment plans to ATI. Two weeks later, drafts will be delivered to the district for review. The reviews should then be completed and returned to ATI within two weeks. The final step is for ATI to finalize, publish, and place the assessments into the district secure library for printing, scheduling, and administration.

Step 1: Planning the Assessments

In this step, districts decide what standards will be included on each assessment. The following are a couple of points to keep in mind:

- A total of three to four assessments per year is suggested.

- All teachers need to know which standards will be assessed on each assessment.

- It is suggested to limit assessments to 35 to 50 items (seven to 20 standards).

- Only five items maximum are needed for each standard.

- Limit the number of reading texts on an assessment by putting all standards for similar genres on the same assessment.
If five items are requested for one narrative, one expository, and one persuasive standard, up to 15 texts may be needed to cover the requested items. On the other hand if three standards which all relate to expository content are picked, the number of texts required to be read to answer all the questions on the assessment will be greatly reduced.

Another type of standard to watch for is the compare and contrast standards. Requesting five items, when each item needs to compare two stories, leads to at least 10 texts. Keeping standards for the same genre together on one assessment will help on these items because the texts will be able to be used to assess multiple standards.

Step 2: Reviewing the Drafts

In this step, districts review the assessments to pick the items located in the item banks which best serve district needs. The following are a couple of points to keep in mind:

- Items should range in difficulty in order to provide information concerning all the students in the group.

- Limit the number of reviewers. More reviewers make it more difficult to make a final decision. It is best to have a couple of key individual reviewers who are very familiar with the districts curriculum, teachers, and goals.

- If possible, use the items which are provided on the assessment. These items most likely have proven parameters which will help provide you with important information concerning student performance on the assessment.


Monday, July 27, 2009

Attending Conferences

Attending conferences can be overwhelming. When you visit a booth, be sure to take home any pertinent literature or samples, etc. that vendor offers. When you get home, all the amazing products you’ve seen over the last day or so might blur together. You may want to jot down a note or two while visiting the booth/vendor so you know what each product offers. This can be a great way to remember later on.

Monday, July 20, 2009

Ah, “Those Lazy, Crazy, Hazy, Days of Summer” ... No data needed for now, but do you want it and will you have it in the fall?

The summer of 2009 is now in full swing with students, parents, teachers, and administrators enjoying a well-earned vacation from a very exciting, busy, and oftentimes challenging school year.

During this past year, and as a result of the American Recovery and Reinvestment Act (ARRA) of 2009, we have seen a remarkable array of new policies and reforms occurring in K-12 education, backed by an unprecedented re-investment in education by the federal government. While this might not be among the “hot topics” of discussion around the summer lemonade stand or by the poolside, it has certainly been on most people’s radar and in the news almost daily these past few months.

Suffice to say, the immediate impact of the Act is akin to creating a new story-line and a new debate among educators, researchers, policy-makers, and the public about the future of our nation’s educational system. Certainly not the stuff of summertime fun but undoubtedly, a topic that will pick up momentum again as the 2009-2010 school year approaches. If however, you find yourself yearning for a summer thirst-quencher on this topic then consider the following.

One of the major goals of the ARRA is to improve our nation’s education system and enhance student learning through the increased use of technology innovations and actionable data to help inform educational decision-making.

In order to accomplish this goal, two key types of data are needed. The first is data on student mastery of state standards obtained not only through end-of-year statewide tests, but more importantly, continuous data on student learning and mastery of standards that can be used in “real-time” to inform instruction and intervention decision-making. Consequently, technology innovations represented in the new generation of online educational management systems must have the capacity to provide local school districts with an integrated array of locally customized assessment tools aligned with the district’s overall educational plan (e.g., pacing guide) for the year. To the extent that student learning and progress can be captured in this fashion, the second type of data – data that documents the impact of interventions on student learning and standards mastery – becomes a reality.

The paramount and practical importance of local school district empowerment in implementing an online educational management system that provides data in this way should not be underestimated. Rapid access to reliable data on student learning - where the student is and what needs to be planned for next for progress to continue - is a key element for planning effective learning opportunities and helping students meet the educational challenges of the 21st century.

It is perhaps stating the obvious to say that the importance of the data lies not in the need to gather and report it, or to simply answer a question, but rather so that positive action in the best interests of students can occur in a timely and purposeful fashion.

As stated by Pennsylvania Gov. Ed Rendell, chairman of the National Governors Association, at the March 2009 forum, Leveraging the Power of Data to Improve Education, “…even the best data collection system is worthless if it does not change what goes on in the classroom."

A few of my friends have wondered about this issue. Why collect data, or for that matter use all this sophisticated technology if it does not really change what is going on? Then there are my other friends who point out, that access to the technology and to the data is not supposed to change things, but rather, make change possible. It’s an interesting debate and I can see a valid argument on both sides.

What do you think? Let us know and in the meantime, enjoy those “Lazy, Crazy, Hazy, Days of Summer.”

Saturday, July 11, 2009

Counting the Mountains and the Lakes: Quantile Regression and NCLB

I am sure that the title of this post sounds a bit odd. Let me explain.....

A statistics book that I was recently reading starts out in the preface with a quote by Francis Galton in which he teased some of his colleagues for always falling back on averages to the exclusion of other analytic approaches thereby missing much of what could be discovered. Galton chided that they were much the same as a resident of “flat English counties, whose retrospect of Switzerland was that, if its mountains could be thrown into its lakes, two nuisances would be got rid of at once (Natural Inheritance).” The author of this statistics book (which can be seen here) then proceeds to describe the use of a statistical technique called quantile regression which provides a means to examine some of the “mountains and lakes” that might be found in data by those willing to look beyond averages. I’ll get back to this procedure in a bit. Don’t worry… I won’t bore you with its inner workings. One of my colleagues here is rather fond of pointing out that statistics isn’t a topic for polite conversation. Rather, I will try and talk a bit about what sort of real life questions quantile regression is being used to answer. Some of these real life questions concern new ways to look at student growth within the context of NCLB.


We are all very aware of the data that are gathered as part of NCLB and the types of questions that these data are used to address. The fundamental question has been: Are children meeting the standard? If they aren’t, then schools and districts are subject to penalties. Over the course of the years since NCLB was implemented, there have been a growing number of educators and members of the research community arguing that this approach isn’t adequately attentive to issues that are essential to the ultimate success of efforts to raise student achievement. The fundamental issue that has not yet been adequately addressed is student growth. Looking only at whether students have met the standard doesn’t make a distinction between a school in which students started at a low level and are making rapid progress towards ultimately mastering state standards from one in which the students started at a similar level but weren’t progressing. To paraphrase Galton, failing to recognize this particular mountain range could mean that opportunities are missed to support educational intervention efforts that are proving successful. Lack of sensitivity to student growth also has potential implications for high achieving students . Without being attentive to student growth, there is no way to highlight the differences between high achieving students who are growing and those that are not.


In order to get a more complete view, several states have implemented growth models for determining accountability under NCLB. Thus far 15 states make use of such a model for determining AYP. The growth model that is used in Colorado is particularly intriguing because of the fashion in which it applies quantile regression to the question of growth. The Colorado approach allows for a student’s growth to be compared against his or her academic peers. Students can be evaluated to determine if they are making more or less progress than students who are essentially starting from the same place. High achieving students aren’t lumped together with students who are behind. This approach focuses attention both on each student’s current level of skill and on the progress that they are making. Because of this more complete view, the Colorado Department of Education (CDE) is able to give schools credit for moving students forward, even if they haven’t yet got to the point where they will ultimately pass the test at the end of the year. This approach also more clearly identifies student progress at the upper end.


The information that looking at accountability in this fashion can provide is obviously more nuanced and complete than the more basic approaches that have been employed. The question that must be addressed is whether the approach is shining the light on all the mountains and lakes that should ultimately be considered. We believe that tracking growth using quantile regression can provide information that is useful for guiding instruction and that cannot be easily obtained in other ways. For example, quantile regression analysis can be of assistance in determining growth rates for students starting at different ability levels. Information of this kind can be very useful for guiding instruction in ways that elevate student achievement and that are maximally beneficial for all students. This fall, ATI will be developing new reporting tools providing growth information derived from quantile regression. We would be interested in hearing from you regarding this initiative. We are particularly interested in hearing from those of you working in states where such an approach has been put in place. How has it worked in practice? What sort of issues have arisen?


Friday, June 26, 2009

On the Assessment of Writing

One of the topics being considered in many states is how to best assess students' writing skills. The implementation of multiple-choice items to assess the writing ability of students has become more popular in recent years. Among states where Galileo K-12 Online is currently used, California and Massachusetts both use multiple-choice items to assess some aspects of writing. Arizona is reportedly adding multiple-choice writing to the AIMS in the next round of pilot testing, and we expect to see those items supporting the revised Arizona English and Language Arts standards which will be adopted in 2010-2011.

It is not surprising that multiple-choice holds a certain appeal for those wishing to assess writing. Multiple-choice items take less time away from instruction, can be scored using automated procedures such as those available to users of Galileo K-12 Online, and are scored consistently due to the use of a single correct answer instead of relying on evaluators to score to a rubric. These advantages make multiple-choice a compelling option, but there are other considerations that limit the usefulness and effectiveness of multiple-choice items in the assessment of writing. The use of multiple-choice to assess writing is an attractive but limited approach. Thomas M. Haladyna explains the limits of using multiple-choice to assess writing in Developing and Validating Multiple-Choice Items:

The most direct measure would be a performance-based writing prompt. MC items might measure knowledge of writing or knowledge of writing skills, but they would not provide a direct measure (p.11).

Therefore a crucial concern is the logical connection between item formats and desired interpretations. For instance, an MC test of writing skills would have low fidelity to actual writing. A writing sample would have much higher fidelity (p.12).

To assess writing, it is necessary to apply a standardized rubric and a writing prompt that allows students to express their responses in a manner that represents accurately their ability to compose, convey and communicate in a way that fulfills the designated purpose of a text and that utilizes appropriate information they possess relevant to the topic.

While multiple-choice reading items addressing an analysis standard may not require the student to compose a full analytical expression, they do require the student to utilize the same analytical processes to identify the correct analysis from the distractors provided. However, the ability to identify the best compositional example does not reflect accurately the skills and abilities inherent in good writing as the ability to recognize persuasive, informative or expressive quality does not indicate the ability of the student to create the same level of written content.

Galileo provides content to allow for writing assessments using prompts for the most authentic measure of student writing, while also covering writing knowledge and skills in multiple-choice items that help to establish data for basic skills measurement and test reliability in predicting standardized test performance.

Text Referenced

Haladyna, T.M. (2004). Developing and Validating Multiple-Choice Test Items (3rd ed.). Mahwah, N.J.: Lawrence Erlbaum Associates.

Thursday, June 18, 2009

Care must be taken when administering benchmark assessments to subsets of students or to students from multiple grade levels

Galileo K-12 Online benchmark assessments serve two functions simultaneously. One is to provide teachers with timely feedback regarding which standards their students have and have not mastered. The other is to forecast the students’ likely performance on the high stakes statewide assessment such as AIMS in Arizona or MCAS in Massachusetts. Both of these functions are equally important, and in most cases both goals are achieved in harmony by the single benchmark assessment. However, there are some cases where the two goals are in conflict. In today’s post, I want to alert district administrators to a potential problem and to give them a way to avoid it when planning benchmark assessments.

In the typical scenario, a benchmark assessment is given to all students in the district in a given grade level. For example, all fifth-graders in the district might take a fifth-grade math benchmark assessment. It is expected that all of these students will also take the fifth-grade math high-stakes statewide assessment. This is important because the benchmark assessment must be aligned to the statewide assessment in order to generate cut scores for performance levels and to forecast student performance on the statewide assessment. If the same set of students is expected to take both the benchmark assessment and the statewide assessment, then the comparison between the two assessments is essentially a comparison of apples to apples, and all is well. The cut scores that are calculated for the benchmark assessment should provide accurate forecasts of student performance on the statewide assessment and, in fact, the accuracy rate for Galileo K-12 Online benchmark assessments is quite high (see the Galileo K-12 Online Technical Manual.)

There are cases, however, where the set of students taking a benchmark assessment is not the same as the set that will be taking the statewide assessment. In these cases, the calculation of accurate cut scores for benchmark assessments becomes more complicated. A common scenario is one in which advanced 8th-graders are taking a high school algebra course and, quite reasonably, they take the high school math benchmark assessments instead of the 8th grade math benchmark assessments. This makes perfect sense for the first goal of benchmark assessments: providing feedback to teachers regarding student mastery of state standards. It does, however, create problems for the goal of forecasting student performance on the statewide assessment. In most cases these students will be taking the 8th grade statewide assessment, and not the high school statewide assessment, and so the comparison when calculating cut scores becomes one of apples to oranges.

In order to calculate accurate cut scores for the high school math benchmark assessment in the above scenario, the scores from the 8th grade students must be removed from the data set, so that the set of students on the benchmark assessment will be the same as the set of students who will be taking the high school statewide assessment. Additionally, care must be taken when calculating the cut scores for the 8th grade math benchmark assessment. This is because a specific region of the student distribution, the advanced students, will not be present in the distribution of scores for the 8th grade benchmark. If no adjustment is made to account for the absence of the advanced students, then the cut scores that are calculated will be too low, and too many students will be classified as being likely to pass the statewide assessment. This, of course, will result in rude surprises when the statewide assessment results come in.

The take-home message, then, is to be sure to be clear about who will be taking benchmark assessments when you are planning them. Steps can be taken in cases such as the one described here to make sure that the cut scores on benchmark assessments are accurate, but only if ATI knows about the unusual circumstances in advance. If you are designing benchmark assessments in Galileo K-12 Online and there will be any out-of-grade testing, or if the set of students on the benchmark assessment will not be the same as the set that is taking a particular statewide assessment, please let your Field Services or Educational Management Services representative know right away. Forearmed with as much information as possible, ATI can work with your district to make sure that the benchmark assessments provide accurate forecasts of student performance on statewide assessments as well as providing timely feedback regarding the mastery of standards to classroom teachers.

Wednesday, June 3, 2009

Help for Math Teachers

The purpose of this thread is to provide information and a way for math teachers to converse with each other about specific states standards both interpretations of state provided language and ideas about how to teach these standards to students.

Please comment on posts or add new posts including questions, ideas, and answers about how to teach math standards.

High School: Post #1

AZ-MCW-S3C4-PO10. Determine an effective retirement savings plan to meet personal financial goals including IRAs, ROTH accounts, and annuities.

AZ provided connection: MCWR-S5C2-09. Use mathematical models to represent and analyze personal and professional situations.

AZ provided explanation: An IRA is an “Individual Retirement Account,” and a ROTH is a specific type of IRA, with a more complex tax-advantaged structure.
I have searched for formulas or information about how to figure returns, advantages, and how to figure how much to invest in order to reach a retirement goal, but I have only found calculators not any information about formulas to mathematically figure the answer.

What materials/formulas do you plan to teach students to figure this information?

Middle School: Post #1

AZ-M06-S2C4-01. Investigate properties of vertex-edge graphs
· Hamilton paths,
· Hamilton circuits, and
· shortest route.

How do you teach students to check their answers on the vertex-edge graph items?

How do you know if you found all possible paths on a vertex-edge graph?


AZ provided explanation: A Hamilton path in a vertex-edge graph is a path that starts at some vertex in the graph and visits every other vertex of the graph exactly once. Edges along this path may be repeated. A Hamilton circuit is a Hamilton path that ends at the starting vertex. The shortest route may or may not be a Hamilton path. Depending upon the constraints of a problem, each vertex may not need to be visited.
Elementary School: Post #1

AZ-M02-S5C2-03. Select from a variety of problem-solving strategies and use one or more strategies to arrive at a solution.

What problem strategies do you think are appropriate to teacher primary students?

Which problem strategies are your student’s favorites?


Monday, June 1, 2009

Share Your Lessons With Others

Have you created a lesson that you are incredibly proud of? Do you wish there was an easier way to let your colleagues access the lesson to use with their students? With Galileo sharing is easy. In order to share your content, you will want to attach it to a Dialog. Don’t worry. You needn’t recreate your lesson in a Dialog. We recommend that you do the following:

  1. Link your Dialog to state standards. Most of your colleagues will search for lessons based on standards.
  2. Give your Dialog a title and add any notes that will be relevant to other users.
  3. Add a description. The words you place in the description box will be searchable by other users once you share your lesson. Examples of keywords could include: emerging language learners, hand-held responders, or teacher-facilitated.
  4. Attach the lesson as a resource.
  5. Automatically generate a follow up quiz. This is optional and only necessary if you’d like to use Galileo’s Formative Test Reports to evaluate students’ learning of the lesson.
  6. Publish your lesson.

Once your lesson is published you can share it in two ways. Once your Dialog is published you will see a Share Dialog button. Click this button to add your lesson to the community bank. Sharing your Dialog to the community bank will allow Galileo users in your district and other districts to see your Dialog when searching, and they can schedule and use it with students. If you would prefer only to share your content with colleagues in your district, that is possible as well. You will just need to provide your colleague’s access to your Dialog Library or copy your Dialog into their library. ATI will be more than happy to show you how this is done. For more information on sharing your lessons, e-mail ATI’s Professional Development staff at professionaldevelopment@ati-online.com for assistance. Or call us at 1-800-367-4762 ext. 132.

Wednesday, May 27, 2009

Benchmark Results by Groups

ATI released a new report this month called the Benchmark Results by Groups report. This report breaks out the students who passed the benchmark goals by subgroup. Combined with customizable forms it allows the user flexibility in reporting. It can be run on an individual class, offering comparisons to the school and district data, all schools, or all classes. In all cases you will receive an “Overall” column for comparison purposes (see screen shot below). At the present time this report is available to district-level users only however ATI has future plans to make it available to all user access levels.

If you are interested in learning more about this report or other components of the system, a WebEx can be set up. A WebEx is a guided tour of the system over the Internet. Please contact the Field Services department at 800-367-4762 Ext. 124 to obtain more information.

For those districts that are current clients, please contact your Field Service Coordinator if you have questions on this report or other components of Galileo.


Wednesday, May 6, 2009

Questions to complement Value Added Measurement

A short while back I wrote a post about the use of Value Added Measurement (VAM) within the context of educational reforms. I mentioned President Obama speaking of the need to reward effective teachers financially. Indeed the impact of effective teachers is well established. There is certainly value in identifying which instructors have the most impact on the learning of their students. However, just as with any set of tools that might be employed to the ultimate task of raising student achievement, there are certain limitations to VAM and merit pay as a source of guidance for policy. One of the most notable is that it provides no insight into what effective teaching actually looks like. My task here will be to make good on my promise from the last post to talk a bit about some additional tools that can be added to the arsenal. As I said before, it makes sense to make use of any tool that we can to tackle this important task.

VAM asks the question who is the most effective in the classroom. What if we added some additional questions such as: what is the most effective way of teaching a given skill? What are the specific needs of students who need additional help? How are they progressing as they receive instruction? These might be thought of as "bottom up" questions as opposed to the “top down” type of inquiries that characterize VAM. The notion is that specific identification of the components of effective construction will support the construction of a larger program. This type of approach could provide a nice complement to the gains that can be achieved from VAM.

What is needed to effectively ask these types of questions? One necessary ingredient is the ability to work collaboratively on the implementation of common objectives, assessments, and instructional approaches across different classes and schools. It must be possible to distribute necessary materials to all the teachers who need them. It must be possible to monitor the delivery of that instruction so that differences across teachers can be identified and, where necessary, they can be addressed. Highly consistent implementation is needed in order to make strong conclusions about what works or doesn’t work.

It also must be possible to gather accurate and reliable assessment data on a frequent basis. Assessments must be shared so that information may be reliably aggregated. Assessments should also be well integrated into instruction so that the picture of learning is highly detailed.

This approach is a nice complement to VAM because it positions us to answer the question of what can be done when differences in outcomes are identified across classrooms. The implicit assumption is that teacher effectiveness can be taught once the components of effective instruction are identified. In a recent article, Stephen Raudenbush describes the successful implementation of a literacy program based on what he terms a shared systemic approach to instruction. Central to the approach are shared goals, instructional content, and assessments. Differences in teacher expertise are expected and the system encourages mentoring by those whose skills are more advanced. Raudenbush argues that this sort of collaborative approach is key to effectively identifying and then implementing the kinds of systemic changes that will ultimately advance instruction and improve schools.

The tools within Galileo have been designed to support the process of determining what strategies are effective in helping students to meet goals. As we described in our recent seminar, the intervention model positions districts to do that sort of collaborative work. We would be interested in hearing responses from those who have worked in a district where such an approach was implemented. How did it seem to work? What sort of approach was taken to implementation? What kinds of problems came up?

Friday, May 1, 2009

The Calculations behind Forecasting Risk and Making Predictions in Galileo K-12 Online

Thanks for the comment on my previous post, Gerardo! I’ll work through the calculations you requested in this response, but the real work is in making sure that the benchmark assessments are properly aligned to state standards and that student scores on the benchmark assessments correlate well with their scores on the statewide assessment. The validity of Galileo K-12 Online benchmark assessments, both in terms of the alignment of content and the correlations with the state test scores, has been well-established (see the Galileo K-12 Online Technical Manual), and so now we are free to engage in a very straightforward, easy, and accurate approach to forecasting student performance on statewide assessments like AIMS.

The first step in forecasting student performance on a statewide assessment is establishing cut scores on the benchmark assessment that correspond to the cut scores on the statewide assessment. To do this we use equipercentile equating (e.g. Kolen & Brennan, 2004). With equipercentile equating, you start with the distribution of student scores on the target assessment. In the example I’ll work through here the target assessment, the one we want to make predictions about, is the 3rd grade math AIMS assessment (the statewide assessment in Arizona). The distribution of scores that is used for the equating process is the set of scores from that particular district’s students on the previous year’s assessment. In this case, 25% of the district’s third-graders had fallen below the critical cut score for meeting the standard on the spring, 2007 AIMS assessment, and so for the 2007-08 3rd grade math benchmark assessments, the cut score for Meets the Standard was set at the 25th percentile. The same approach was used for the other two cut scores (Approaches and Exceeds) but for the purposes of this discussion, we are only concerned with the cut score for Meets, which is essentially the pass/fail cut score.

Once the cut scores for benchmark assessments are established, they can be used to estimate each student’s degree of risk of not meeting the standard on the next statewide assessment. As stated in my original blog on this topic, we have found that observing a student’s pattern of performance across multiple benchmark assessments yields more accurate forecasts of likely performance on the statewide assessment than does looking at the student’s score on one assessment in isolation. Classification depends on whether the student scored above or below the cut score for Meets the Standard on each benchmark assessment. If the student scored above the cut score for Meets on all three, then she is said to be On Course for demonstrating mastery on the statewide assessment. A student who scores below the cut score on all three assessments is classified as being at High Risk of not demonstrating mastery. Scoring above on two out of three assessments earns the classification of Low Risk and scoring above on only one out of three assessments earns the classification of Moderate Risk.

In Galileo K-12 Online, the reports that indicate student risk levels are linked directly to instructional materials and other tools to support intervention efforts with students who are at risk. This support for intervention efforts is the primary purpose of the risk classification scheme. But it is important to demonstrate that the classification scheme is accurate, which brings us to the data summary that Gerardo asked about.

The table below presents the data for the example I’ve been working through here.


The data are from a particular district’s 2007-08 benchmark assessments in 3rd grade math. The panel on the left shows the different possible patterns of performance on the series of three benchmark assessments: the first row represents students who scored above the cut score on all three benchmarks, and so on. The next column indicates the Risk Level classification for each pattern of performance. Note that scoring above the cut score on two out of three benchmark assessments leads to the same Risk Level classification, regardless of which two assessments were passed by the student. The number of students who showed each pattern of performance is indicated, as is the number of students in each pattern who did and did not demonstrate mastery on the AIMS assessment. For example, there were 238 students who scored above the cut score for Meets on all three benchmark assessments. Of these students, 234, or 98%, also met the standard when they took the AIMS assessment at the end of the year. The percent who met the standard in AIMS for each of the other risk groups was calculated in a similar manner. For the Low Risk group, it was simply a matter of adding up the number of students who passed the AIMS assessment (15+5+26), dividing by the total number of students in that risk group (19+9+34) and then multiplying by 100 to get 74%.

The Percent Met Standard column in the table presented here corresponds to the data in the table at the end of my previous post (“Forecasting Risk and Making Predictions about AMOs”). In that table, I presented averages for each Risk Group that were based on data from 7 school districts in a pilot investigation. The averages are collapsed across all of those districts and all grade level and content areas. We have plans to investigate this further, and I will keep the readers of this Blog posted in any developments.

The final column in the table indicates the accuracy of forecasting performance on AIMS for each of the Risk Groups. For the On Course and Low Risk groups, the prediction is that they will most likely meet the standard on AIMS. For these groups the calculation of the percent accuracy is the same as the calculation of the percent who Met the Standard in the previous column. For the other two groups, the prediction is that they will most likely NOT meet the standard on AIMS, and accuracy here refers to the percent of students who, as predicted, did not meet the standard on AIMS. For the High Risk group, accuracy was at 87% because 13% of these students met the standard on AIMS in spite of their failure to do so on any of the benchmark assessments. Even more interesting is the Moderate Risk group, for which accuracy was only 59% because 41% passed AIMS in spite of our prediction. At ATI, we actually like to be less accurate in these two categories. If our prediction is wrong with these students, it suggests that they and their teachers worked very hard, and they managed to pass the statewide assessment against the odds. We hope that the Galileo K-12 Reports and instructional materials were a part of that effort. That’s what it’s all about.

Reference

Kolen, M.J. & Brennan, R.L. (2004). Test equating, scaling, and linking: methods and practices. New York: Springer.

Thursday, April 30, 2009

Good Help - Not So Hard to Find

In a recent hotel stay, my room included free wireless Internet access – a common amenity. After connecting to the hotel’s Wi-Fi network I noticed the setup instructions on the desk placard, listing the URL of a support website. The ‘simple’ instructions did not include a tech support phone number – just the URL. Interesting contradiction, I thought… “how does one request assistance connecting to free Wi-Fi when the only way to request assistance requires connecting to the Wi-Fi?”

Rest assured, your participation in the Galileo K-12 Online and Instructional Dialogs trial offer will not put you in this awkward position. As part of the trial, ATI provides the same level of support we provide to all Galileo clients. ATI support offerings include extensive Galileo online help files, website form submission for general and tech-related questions, email support via
support@ati-online.com, and telephone help available at (800) 367-4762 x130.

Support is available for computer and browser-related issues encountered within Galileo K-12 Online, supported eInstruction and Promethean response pad setup and use, and general Galileo K-12 Online and instructional Dialog use.

Monday, April 20, 2009

Using the Trial Offer to the Fullest

Those who attended the February Educational Interventions Forum hosted by Assessment Technology, Incorporated received an offer to participate in a trial of Instructional Dialogs in Galileo Online that were specifically built for forum participants. Assessment Technology's Instructional Dialogs are interactive, technology-based instructional content, , which involves educators in developing and sharing proven educational strategies through lessons designed to increase student mastery of state and local academic standards.

The Instructional Dialogs created for the Educational Interventions Forum were assembled into customized sets for each of the states involved in the forum. The intent was to offer participants a quick, easy to use set of interventions that would allow for a quick review or a new approach to introduce standards that were likely to appear on the end of year state test. Now as state testing is wrapping up in some states and soon to begin in others there is still an opportunity to use the Instructional Dialogs. The combination of instructional content and immediate feedback provided by the optional test attached to the dialog will allow you to evaluate areas that may still be essential to the completion of the courses the students are finishing this semester.

Accessing the available Instructional Dialogs from the trial offer will allow a quick and simple learning experience focused on one of these important standards. The use of the trial dialogs will also allow teachers to familiarize themselves with the types of activities that are available through the Galileo Instructional Dialogs banks. Districts who already subscribe to Galileo for their educational management and assessment needs will be able to sample these Instructional Dialogs and then move to working with the more than 800 dialogs written for math and English. For districts considering Galileo, the dialogs will provide an indication of the types of instructional content that Assessment Technology is committed to providing through our continuous expansion of the Instructional Dialogs.

To access the trial dialogs, please contact the Field Services department at Assessment Technology, Inc. (520) 323-9033 or 1-800-367-4762.

Thursday, April 2, 2009

Forecasting Risk and Making Predictions about AMOs

If you’re a user of Galileo K-12 Online, or an avid reader of this Blog, you’ll know that one of the primary services Galileo provides is forecasting student risk of not meeting state standards based on their performance on benchmark assessments. The information is designed to help identify students in need of intervention, but it is tempting to use it to get a preview of where the district or school stands with regard to AMOs. The data can be used for this purpose, but I wanted to highlight some points to consider when doing so.

The Aggregate Multitest report can be run in two modes and the choice is made by selecting either the Display risk levels or the Display benchmark performance levels radio button. When the Aggregate Multitest report is run with the benchmark performance levels option, it generates an independent analysis of student performance for each of the selected assessments. Based on their performance on each benchmark assessment, students are categorized into the same classification system that the statewide assessment uses, such as the FAME scale in Arizona or the Advanced, Proficient, Needs Improvement, or Warning categories in Massachusetts. What you’ll see below the bar graph is a display that shows the percent of students in each category, such as this:


It is easy to see how this data would tempt a person to try to project where the schools in the district are likely to stand relative to the AMOs at the end of the year. Let’s say that in this example, the AMO for 4th grade math is that 66% of the students must be classified as either Meets or Exceeds on the statewide assessment. Adding these categories together for benchmark #1 indicates that 61.71% fall into these categories. That’s not quite enough. On benchmark #2 the number rises to 65.66%, which is close, and then finally with benchmark #3 the figure of 72.80% surpasses the AMO.

That’s good news, right? Well, maybe. Probably. Our research has indicted that Galileo benchmark assessments are very good at forecasting likely student performance on statewide assessment. But our research also indicates that considering student performance on multiple benchmark assessments yields even more accurate forecasts of student performance on statewide assessments than considering student performance on individual benchmark assessments in isolation. This is true even when the one, isolated benchmark assessment is the one that is administered most recently when statewide testing begins, as would be the case with benchmark #3 in this example. Details of these investigations can be found in the Galileo K-12 Online Technical Manual.

In order to capture the increased accuracy of data from multiple benchmark assessments, the Galileo K-12 Online Risk Assessment report was developed. The Risk Assessment report is accessed via the second mode for generating the Aggregate Multitest report, by selecting the radio button that says display risk levels. The Risk Assessment report provides the same information Kerridan referred to in her recent post (How Can Galileo Assist in Interventions?), except that the data can be aggregated at the school or district level as well as the classroom level, and it yields a display that looks like this:


Students are classified into the different levels of risk according to their performance on a series of benchmark assessments. This example refers to the same three 4th grade math assessments that were considered earlier. Students are classified as being “On Course” if they scored above the cut score for “meets” (or “proficient” in many other states) on all three benchmark assessments. If they fell below that cut score for one assessment, they are classified as being at “Low Risk”. If they fell below on two of the three assessments, they are at “Moderate Risk”, and students who never scored above the critical cut score are classified as being at “High Risk”. Kerridan’s blog illustrates how to use this information to plan interventions.

This method of projecting student risk of not meeting the standard on the statewide assessment has proven to be very accurate. On average, 96% of students who are classified as being “On Course” after three benchmark assessments go on to demonstrate mastery on the statewide assessment (see the Technical Manual). This is the most accurate approach to projecting student risk for the purposes of identifying students for intervention efforts. It is also the most accurate information a district could have when assessing risk with regard to AMOs. However, because its primary function is to identify groups of students for intervention efforts, its format may not be the most convenient for looking toward AMOs. In this case, only 52% of the students are on course, which is well below the AMO of 66%. But a district can count on a number of students from each of the other risk categories to pass the statewide assessment as well. We have conducted a preliminary investigation, based on 7 large school districts, to see how many students in each risk level category tend to go on to demonstrate mastery on the statewide assessment. The results are presented in the following table.

Monday, March 30, 2009

How Can Galileo Assist in Interventions?

As I interacted with school districts during the Intervention Forum, a number of people wanted to know exactly how Galileo could assist educators with interventions. You already know Galileo provides assessment data which is broken down by standard. It allows educators to see which students have made progress and which students still need additional instruction. While this information helps to identify which students may need additional help, the more challenging task is finding content to use in an intervention. Galileo not only helps identify and group students for you, but Galileo suggests Instructional Dialogs that can be used in your re-teaching initiatives.


The Risk Level report on the Benchmark Results page will group a class of students based on how at-risk the student is for not passing the state assessment. You will want to identify the group of students that you would like to expose to an intervention: High Risk, Moderate Risk, Low Risk or On Course students.


Once you have identified a group of students to work with, you will be presented with an intervention strategy for that group of students. Galileo will organize all of the standards tested into steps for re-teaching. Determine which instructional step you’d like to focus on. Then click on the Assignments button to see recommended Instructional Dialogs for each of the state standards that make up that step of the intervention strategy.


The Dialogs listed are links, so you can preview the lesson and see if it is something you’d like to use with the group of students. Teachers have implemented Dialogs by having students do them online, they have given students hand-held responders to use as they presented the Dialog, and teachers have simply presented the Dialog and have asked students to verbally respond. Notice as you preview a Dialog, each one has a quiz or a formative assessment attached. This quiz is meant to help teachers determine if students learned the standard during the intervention.

If you see a Dialog you’d like to use with students, just continue scrolling down the page and complete the online form to schedule the Dialog.


You are now ready to proceed with your intervention. As you can see, Galileo automatically links assessment data to instruction. Your benchmark data assesses the instruction that has occurred. You can run and analyze reports broken down by individual standards and individual students to determine what students need help with. You can then group students and assign already-made instructional Dialogs to aid in re-teaching students. And finally, to ensure students have learned the content of a re-teaching intervention, there is a follow-up quiz or formative assessment that can be administered automatically to students.
Have you had a chance to use or implement Dialogs? Tell us about the experience.

Tuesday, March 24, 2009

Are Instructional Dialogs a Good Teaching Methodology?

In one of the many discussions during the breakout session in the forum, the question was posed as to whether Instructional Dialogs should be considered a good teaching methodology or whether Instructional Dialogs were just an easy way for a teacher to get through the day. First, the question, “What makes a great teacher?” needs to be considered. This question has endless answers and has been greatly researched. Responses vary and are numerous. Here are just a few examples.

Great teachers:
· Clearly state a daily learning objective, refer back to it, and check for mastery.
· Are organized and prepared for class.
· Understand the subject matter they are teaching.
· Involve students and encourage them to think at a higher level.
· Consider student’s current academic level and instruct students based on their specific needs.
· Communicate with parents on a regular basis.
· Expect big things for all students.
· Build relationships with their students and care about them as people first.

Instructional dialogs share many of the characteristics of a great teacher. Each Instructional Dialog clearly states a learning objective and consistently refers back to the objective. Throughout the instruction, the child is checked for understanding using instructional questions and feedback. Finally, the formative quiz at the end of the instructional dialog shows whether the student has mastered the skill.

Preparation and organization is key for a great teacher. The instructional dialog is completed, perfected, and scheduled before the beginning of class. This allows the teachers to be well prepared for instruction.

Having the ability to link to experts all over the Internet and allowing the teacher to give students access to the best resources available in order to develop a thorough understanding of the topic is a huge plus when using Instructional Dialogs. Instructional Dialogs also provide teachers the ability to get help in explaining and understanding more complex topics.

The feedback portion of the instructional dialogs pinpoints the student mistakes and provides specific direction as to what the learner needs to do differently to master the standard. This feedback not only teaches students at their current level, but it encourages learners to think at a higher level. In other words, it forces students to analyze their own mistakes.

When a teacher posts the results from an Instructional Dialog, Galileo allows parents to see student academic progress. This tool helps teachers easily communicate with parents. Coupling instructional dialogs, formative assessments, and benchmark assessments using Galileo creates a record for parents to see constant academic development of their child.

A couple of intangible characteristics must be added to instructional dialogs to perfect this exciting teaching methodology. These include but are not limited to love of learning, love of people, expectations for success, and fun. We all know that computers will never be able to replace a great teacher, but instructional dialogs can definitely make great teachers even greater!

Friday, March 20, 2009

The National Call to Measure Teacher Effectiveness

On March 9th President Obama made a speech about the vision of his administration for education. The speech included calls for some controversial things. One of the hottest topics was the idea of rewarding more effective teachers with extra pay. Conversations around this topic quite rightly raise questions. What measures are fair to determine which teachers are the most effective? How do we account for the fact that teachers don’t get a randomly selected group of students? What kinds of stats are the most fair to evaluate the results?

All of these questions warrant careful consideration. In that light, a quick look at what we already know about some of the issues involved in answering these questions is in order.

The first issue that should be considered is the objective research data which speaks to whether there is a teacher effect on student achievement that can be quantified. In short, the research shows that an effect for teachers can be demonstrated and that the effect lasts beyond the time the student is in that teacher’s class. Some findings have shown that the impact of having an effective teacher can still be measurable 3-4 years later. This finding would suggest that students who are assigned to a particularly effective teacher for several years in a row will likely be far ahead of a student who hasn’t been assigned to equally effective instructors. Interestingly, the links between teacher variables such as credentialing have been at best weakly associated with achievement. This research is nicely, and thoroughly, summarized in a monograph prepared by the RAND Corporation.


While the research world has pretty consistently shown that a teacher effect on student outcomes can be measured, it gets a whole lot more complicated when you dive into the specifics. One of the first nitty gritty questions that must be considered is how exactly should a teacher effect be quantified? Many researchers have employed Value Added Modeling (VAM) to address this question. In short, VAM asks the question of how much variance in a student measure of achievement can be attributed to the teacher. Estimates of teacher impact obtained by utilizing VAM can be influenced by a number of variables including the impact of the way in which teacher variables and other possible confounds are modeled, the measure of student achievement that is selected, and the impact of missing data. The RAND monograph provides a very useful summary of the impact of some of these issues and their impact on conclusions that might be drawn.

All of these questions might lead one to the conclusion that developing a VAM based approach to measuring teacher effectiveness is too complicated to be able to pull off effectively. Such a conclusion would be misplaced. Many papers on the topic of VAM have consistently shown that the data provided by this approach can be useful in answering the types of questions that would face policy makers charged with delivering on President Obama’s call to design a system that can be used to reward teachers who are effective. While VAM is certainly useful, we would suggest that several things happen if it is to be employed for this type of work. The first is that skilled researchers who are familiar with the types of issues that impact VAM estimates should be involved in the design of the system on which policy makers make their decisions. Second, these same researchers also need to be able to engage in research to further understanding of the impact of various issues on VAM estimates.

Before I sign off for this post I want to raise a different but related issue for consideration. Ill bring it up here as an introduction for a post that will follow shortly

Implicit to the merit pay discussion is the idea that providing such incentives will ultimately elevate the level of instruction and lead to higher student achievement. It is our view that the goal of elevating student achievement should be looked at with all the tools that are at our disposal. Just like any other tool, VAM type analyses have certain strengths and notable weaknesses. One of the most notable shortcomings of VAM is that it can tell us little about what effective instruction looks like. It can’t provide any information about what the more effective teachers do that makes a difference. Other types of approaches that I will talk about in subsequent posts can nicely complement findings from VAM based work by addressing this very issue.

As always we look forward to hearing the thoughts of our readers