Showing posts with label Benchmark Performance Levels. Show all posts

Monday, May 6, 2019

The Benchmark Performance Levels Report Provides an In-Depth Analysis of Student Learning

Check out the enhancements to the Benchmark Performance Levels report! It now provides teachers and administrators the capability to evaluate student performance on multiple measures involving classes and schools. This report is useful to answer the following questions:
  • which students need intervention?
  • which standards have students mastered? 
  • which standards should be retaught?
  • is student performance improving throughout the year?
  • how does class performance compare to school and district performance?
  • how does student performance compare across content areas?
  • which schools and classes are excelling or struggling?
  • how are students performing in each of their classes?
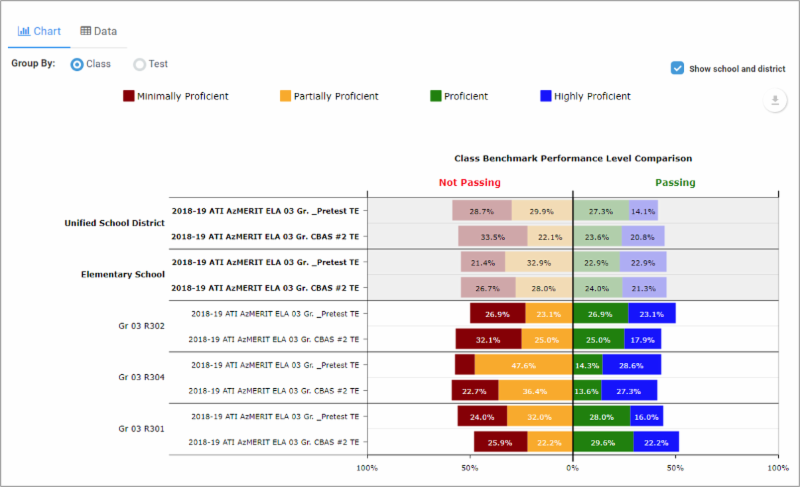
Compare performance across tests at multiple levels in the Benchmark Performance Levels report. 

The new report is accessible from the Benchmark Performance Levels report on the Teacher- and Admin Dashboards as well as from the Reports menu. Chart views include colorful bar graphs that illustrate patterns of performance. Data views provide interactive data tables that enable custom search and sorting. Additionally, print and export capabilities support a variety of formats such as JPG, PDF, and Excel.

Learn about additional reports found on the Galileo Dashboard.

Monday, November 13, 2017

What You Need to Know About the New Reporting Functions on the Teacher Dashboard

ATI recently released a new widget on the Galileo K-12 Teacher Dashboard.  This new widget displays Benchmark Performance levels on pre, post and benchmark assessments.  The Benchmark Performance Levels reporting widget displays the percentage of students in each performance level. This performance level is based on where a student’s Development Level (DL) score falls relative to the cut scores and the respective levels, on each benchmark assessment taken. The cut scores on the benchmark assessments are set to correspond to the cut scores and performance bands on the state standardized test. When a user drills down via the View Detailed Benchmark Performance Levels link, he or she will see student and aggregate data including performance levels, student scores, and standards mastery.  New functionality has been added which includes a search and sorting capability.


Additional Resources
Learn more about the Performance Widget with the Quick Reference Guide: http://bit.ly/2zyzebV
Explore the Benchmark Performance Levels in Galileo with this brief webinar: http://bit.ly/2jmOy4U

Written by Kerridan Kawecki , Professional Development Director

Monday, October 9, 2017

New One-Click Benchmark Performance Levels Reporting Widget by ATI

The new Benchmark Performance Levels reporting widget accessible from the Teacher Dashboard summarizes multiple measures of student performance on district benchmark assessments (e.g., mathematics, English language arts, and other subject areas) for your entire class at once. The colorful pie chart and interactive data displays of assessment results can be used to guide instruction, intervention, and enrichment using the Galileo Digital Curriculum Platform and Galileo online lessons (e.g., Dialogs). Benchmark Performance Levels reporting widget highlights follow.

One-click “Big Picture Class Summary” for each assessment including: 

  • color-coded performance levels (e.g., highly proficient, partially proficient) including number and percent of students at each level
  • easy-to-interpret Developmental Level (DL) Score range for each performance level
  • instant access to number of students assessed, average percent correct, average DL Score, and average percent of standards mastered for the class


One-click “Detailed Class Portrait” for each assessment including:

  • total points, percent correct, DL Score, and performance level for each student
  • color-coded standards mastery level for each standard assessed (e.g., exceeds standard, meets standard)
  • item count for each standard assessed
  • one-click access to all items used to assess each standard, including item meta-data (e.g., Depth of Knowledge)
  • rapid “Data Search” allowing search by student name, total points, percent correct, or DL score 
  • one-click “Data Sorting” in ascending or descending order by student names, total points, percent correct, DL Score, percent of standards mastered, or standards mastery category  
  • instant Comparative Analysis Report summarizing assessment results for the class, school, and district
  • one-click “Excel Export” for use in conducting further analysis and for creating additional graphical displays such as pivot tables and bar graphs
Register to attend the Thursday, November 2 Learning on Demand session "Exploring the New Benchmark Performance Levels Reporting Widget." Margaret Johnson, ATI Professional Development Specialist, will walk you through accessing and interpreting data from the Benchmark Performance Levels reporting widget. She will illustrate how the summary data as well as the individual student data can be generated which helps to inform instruction and monitor student progress throughout the year. The Learning on Demand session is designed specifically for teachers and specialists responsible for instructional interventions and progress monitoring.

Register on the "Upcoming" tab in the Training Center.


One-click reporting options available in the new Benchmark Performance Levels reporting widget.
Additional Sources of Interest