Showing posts with label Galileo reports. Show all posts

Monday, January 8, 2018

Galileo Offers Flexible and Dynamic Reporting Options

Information on student mastery is a critical element in the educational decision making process. To ensure the availability of appropriate data associated with multiple types of educational decision making, Galileo technology offers a broad set of ready-made, standards-aligned reports. For example, educators have expressed to us the importance of analyzing trends in student learning. Therefore, our team of developers created and added the Student Growth and Achievement Report to the menu of ready-made, standards-aligned reports in Galileo. This report provides a graphical cross-classification of students based on their growth between two tests and their achievement on the second test. This graphical summary is designed to facilitate the identification of student groups for intervention and enrichment (e.g., high performing students showing inadequate growth, low performing students showing exceptional growth).

Following is a sampling of current Galileo reporting capabilities:

  • Curriculum Monitoring Reports provide the ability to monitor both the progress of instruction and evidence of student learning for each standard in a district curriculum. 
  • “At-A-Glance” Overviews present highlights of data from multiple sources in one convenient location with direct links to more detailed reports. 
  • Development Profiles provide counts and percentages regarding student performance on each of the standards assessed on a test. Ideal for monitoring progress in mastering specific standards. 
  • Development Summaries present a series of standardized scores that summarize development at the individual student level or at various other levels of aggregation (e.g., class, individuation group). Ideal for monitoring progress in terms of the relative standing of a student, class, or school. 
  • Aggregate Multi-Test Reports provide Developmental Level scores for multiple tests presented on a common scale used to monitor progress and estimate mastery. These reports include two important forecasting tools for district-wide assessments: the Benchmark Performance Levels and Risk Levels displays.
    • Display Benchmark Performance Levels Option provides counts and percentages of students at each of the statewide assessment performance levels. The user can drill down to identify the students at each of these levels for each benchmark assessment. Presented simultaneously for multiple assessments in order to monitor progress. 
    • Display Risk Levels Option uses patterns of student performance across benchmark assessments to identify and monitor groups of students at various levels of risk with regard to passing statewide assessments. The user can drill down to identify groups of students at each level of risk for intervention. The report identifies standards for which intervention is required. 
  • Testing Reports provide various types of information about tests, including item analysis (the pattern of student answers for each question), test scores aggregated at various levels, and Item Response Theory parameters for each item on the test. 
  • Administrative Reports facilitate monitoring system activity including tracking administration of district-wide assessments, real-time monitoring of student progress during assessment administration, and user activity.


Dashboards: Central Location for Often Accessed Reports
Galileo Dashboards provide users a centralized location from which to view and interact with actionable, real-time data on student learning. Dashboards contain easily interpreted graphical reports that make it easy to identify trends in student performance. These reports also provide educators with actionable data and the right tools for facilitating data-driven, standards-based differentiated instruction based on skill mastery, standards mastery, and pattern of progress.

Student growth data and performance measurements can be accessed quickly from the Teacher Dashboard reporting options.

Data-Driven Differentiated Instruction
Galileo reports provide actionable assessment results that quickly inform differentiated instructional decision-making of three essential types:

  • Skill mastery with instruction guided through information from the Test Monitoring Report and Detailed Item Analysis Report
  • Standards mastery with instruction guided through information from the Intervention Alert and Instruction Performance Tracker
  • Pattern of progress with instruction guided through information from the Student Growth and Achievement Report

The data from these reports supports the decision making power to easily provide students with a broad diversity of instructional materials aligned with individual student learning needs including ATI Instructional Dialogs, KHAN ACADEMY® videos, and activities, EngageNY lessons, LearnZillion resources, and educator-developed materials

Reliable Data on Student Learning
Galileo reports are generated from reliable and valid assessment results from district-wide benchmark, pretests and posttests, end-of-course, school/district and classroom formatives, and an array of other Galileo assessments. Report data details student learning in a number of ways including student mastery of standards, next instructional steps to promote learning with continuous tracking of student progress, and forecasting of student performance throughout the year. 

To learn more about the broad set of Galileo reports, access our website or contact a knowledgeable Field Services Coordinator.

Other Resources of Interest:
New One-Click Benchmark Performance Levels Reporting Widget by ATI
Galileo Dashboard Reports Facilitate Differentiated Instruction
Are You Currently Measuring Both Student Growth and Achievement (SGA)?

Monday, February 8, 2016

Galileo Reporting

The reports found in Galileo provide a wealth of information. Teachers, administrators, and specialists can obtain actionable, real-time data on student learning with Galileo. Reliable and valid assessment results from district-wide benchmark, instructional effectiveness pretests and posttests, end-of-course, computer adaptive, formative, and an array of other Galileo assessments are rapidly available. Report data details student mastery of standards, next steps in the design of instruction to promote learning with continuous tracking of student progress, and forecasting of student performance throughout the year.  

Educators can easily access a variety of reports and act on data that is available from the Galileo Dashboards. Dashboards provide a single location from which to view and interact with curriculum, assessment, and actionable assessment results. This data can quickly inform differentiated instruction decision-making for individual students, classes, and tiered intervention groups based on their skill mastery, standards mastery, and/or pattern of progress.  

To learn more about various reports in Galileo, register for complimentary ATI Professional Development Learning on Demand (LOD) sessions. This month we will be featuring two sessions on commonly used reports, the Test Monitoring Report and the Item Analysis Report. To register for these sessions, click here or contact the ATI Professional Development team directly at ProfessionalDevelopment@ati-online.com.

Test Monitoring 
Date: Wednesday, February 3 
Time: 5:00-5:45 pm EST 
Audience: Teachers and Test Administrators responsible for monitoring students during online test administration 
Description: This session walks participants through accessing and interpreting the new Test Monitoring Report. In addition to detailing how the report may be used during and after testing, the session will highlight the page’s new capabilities, such as displaying TE (technology enhanced) items and linking to the Score Test page.

Interpreting Item Analysis Data 
Date: Wednesday, February 17 
Time: 4:30-5:15 pm EST 
Audience: Educators interested in analysis of student performance on an assessment by standard and item 
Description: This session walks participants through accessing and interpreting the Item Analysis Report views.

View the full schedule of Learning on Demand sessions.

Monday, October 7, 2013

One Test, Many Uses

“Help! I’m stuck between my administrators who want to use the December benchmark as a predictive and my teachers who want to use the December benchmark as a summative semester final. What can I do?” 

One single benchmark, if created appropriately, can serve both purposes. 

How? 

Every state is required to have a list of standards students at each grade level need to master. It is the district’s responsibility to make sure that every child masters these standards by the end of the school year. In order to ensure this goal is achieved, many districts provide pacing guides to teachers in order to keep both teachers and students on pace to master all standards by the end of the year. These pacing guides identify which standards are supposed to be taught at what point during the year. The benchmark assessments are then created based on the district pacing guide. 

The ideal benchmark assessment should be between 35-50 items long and have no more than five items on one specific standard. Using the standards taught during the first half of the year can provide both a reliable predictor of students’ progress towards mastery of the state standards and a valid summative assessment for what students were taught in the classroom. The question then becomes how do teachers take the results of these benchmark assessments and translate them into grades?

The answer to this question depends on the district’s method for grading students. The easiest and most straightforward method is a standards-based grading system. This method of grading provides information as to whether a student has mastered a standard or skill or where he or she is at in developing the skill. Information on standards mastery can be obtained using the Galileo® K-12 Online Intervention Report.

Using benchmark assessments for a more traditional method for grading, (e.g., providing a letter grade for students based on percentages) may need more thought. In order to provide accurate ability estimates for students at all ranges of ability, it is important that there is a range of difficulties on the items and that even the student at the highest academic levels needs to be challenged. As a result, sometimes the raw scores do not represent the level of growth and success students have actually demonstrated. One example is an assessment where the average raw score percentage was 46 percent, yet students demonstrated an average growth of 20 points on their Developmental Level scores (DL). Teachers and districts can use Galileo’s benchmark data  when assigning traditional grades. One suggestion to assign grades is to generate a classroom Benchmark Results report.  The report provides information for each student’s risk assessment. By providing a grade (e.g., A for On Course, B for Low Risk, C for Moderate Risk, and D or F for High Risk), valid and reliable student data may be converted into a traditional grading system.


- Karyn White, M.A.
Educational Management Services Director


Monday, November 26, 2012

Customizable Rating Scales and Actionable Dashboard Reporting Technology


School districts across several states have expressed the need to develop, customize, administer and manage implementation of their own teacher and principal evaluation tools. The Galileo Instructional Effectiveness Assessment System (IEAS) addresses this need by giving school districts online access to the Administrator Dashboard with instructional effectiveness widgets.

Among other tools, the dashboard includes: 1) an Educator Proficiency Scale Builder; 2) Proficiency Rating Scale Administration tools; 3) an Educator Proficiency Ratings Progress Report; 4) a Proficiency Rating Results Report; and 5) Staff File Import and View functionality.


These features make it possible for a district to take control over the development and use of teacher and principal performance rating scales aligned to the Interstate New Teachers Assessment and Support Consortium (INTASC) Professional Teaching Standards and the Professional Administrative Standards from the Interstate School Leaders Licensure Consortium (ISLLC).

In addition, if the district already has a measure of teacher performance, they may upload data from this existing measure collected outside of Galileo or enter the existing measure (with appropriate copyright permissions if applicable) into Galileo for administration and data collection within the system.

Galileo IEAS Dashboard Reports provide school districts with the capability to manage the implementation of rating scales and to gain rapid access to a continuous flow of actionable information not only to identify the proficiency levels of teachers and administrators at the end of the year, but also, to inform professional development decisions to enhance student learning throughout the year.

For more information of the components of the Galileo IEAS, click here.

Tuesday, October 23, 2012

Custom Test Report

The Custom Test Report is a valuable tool for viewing formative and benchmark test results, including student demographic data that can be used to compare result sets. Filtering and sorting data within a Custom Test Report is easy using Excel. To benefit from the power of this tool, just create your custom test report as desired. 

After creating the report, click the link to show “Custom Test Report Activity”:


On the main Custom Test Report activity page, wait for your report name to appear on the list and click the filename to open the report:


The file will open in your default text editor. Next, use the keystroke combination “Control+A” to select all text in the file, then use keystroke “Control+C” to copy the text to your computer’s clipboard.

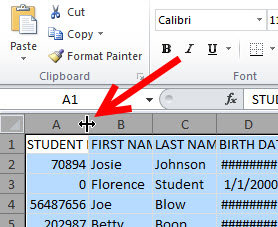
Once the content is copied to the clipboard, open Excel and select cell A1, then use the keystroke combination “Control+V” to paste the content into the spreadsheet. Left-click in the cell above and to the left of A1 to highlight the entire sheet, then double left-click on the border between columns A and B to expand all columns to the appropriate width:


Next, just click on “Home” -> “Sort & Filter” -> “Filter” to set the auto-filtering:


Once this is complete, choose any filtering value you wish. For example, filtering based on grade levels is done by clicking the down-arrow at the top of the appropriate column and then eliminating all undesired grade levels:


Note the report is now filtered appropriately by removing all non-fourth-grade students:


Alternatively, you can sort data within any column by selecting the desired column and using the “Sort & Filter” button selections:


For more information or a quick reference guide on how to create a Custom Test Report, please contact your Field Services Coordinator.

Monday, October 8, 2012

Planning for Parent/Teacher Conferences

As the school year continues to roll on at an increasing pace, it is time to start thinking about one of the most important times of year in the classroom. In many cases we’ve run straight through the first quarter and are bearing down on the end of the first semester. Many schools are beginning to think about planning for parent/teacher conferences. So what are the best tools we can provide parents with for these meetings? There are a couple of reports and documents that teachers can bring with them to help illustrate to the parents or guardians where the student is and what he or she can work on. 

Student Assessment History – The Assessment History Report is a useful tool to summarize the student’s full performance. The report can be run with benchmark, formative, and external test data available. The teachers can give the parents a nice snapshot of their student’s performance so far in the school year.


Individual Development Profile – This is another report that interested parents might find useful. This report is actually linked on the Student Assessment History Report, and it breaks down an individual student’s performance on each standard tested on the most recent assessment.


Student Multi-Test – As you may or may not be aware, a very informative report in Galileo is the Aggregate Multi-Test Report. This is report provides projections for student performance and places scores on a common scale, complete with Risk Analysis and a handy graph. What you may not be aware of is the fact that there is the exact same report that can be run on a specific student.


Psychometrics Quick Reference Guide – Now that the parents have seen the Student Assessment History and the Student Multi-Test reports, they may have a decent understanding of where their student stands, but they also might like some more information on how these developmental level scores are created and what they mean. The psychometrics quick reference guide – available within the Professional Development Forum within Galileo – will help to explain how these scores are generated.

Parent
Quick Reference Guide – There are also many documents that can help a parent feel more involved in their student’s education, one such document is the parent-student center quick reference guide – available within the Professional Development Forum within Galileo – that walks the parent or guardian through the K-12 Student-Parent Center.  For districts that choose to share class information, teacher information, notes, and more within the K-12 Student-Parent Center, this would serve as a great tool for outlining what type of information can be found there.

Ensuring that the teachers have the most important information at the ready and the ability to help relay that to the parents will help to get the parents more involved in their student’s education and open the lines for communication.

-Christopher Domschke
Field Services Coordinator

Monday, April 16, 2012

Galileo K-12 Online Categorical Growth Summary Report Overview

How are your schools preparing to show data on expected student growth per teacher? You can now review expected growth rate data within Galileo K-12 Online by running the new Categorical Growth Summary Report. An educator can utilize this data to monitor their students’ growth between two assessments and an administrator can utilize this data for an educator’s evaluation.

How does Categorical Growth Analysis work?
The Categorical Growth Analysis (CGA) model provides an objective evaluation of the magnitude of student growth. ATI uses the CGA approach to evaluate student growth from the pretest to the posttest that can be applied even to individual classrooms, regardless of district/charter school size. This is how the approach works:
  • Cut scores for the pretest and posttest are established. The cut scores on the posttest are raised relative to those on the pretest by the amount of progress that is expected over the course of the year. The posttest cut score is based on the average expected growth across a large number of districts.
  • Classify students at Time 1 (the first test/pretest) with regard to whether they demonstrated mastery of the state standards.
  • At Time 2 (the second test/posttest), track whether each student's mastery classification stays the same as it was at Time 1, or changes.
  • Focus on the students who changed mastery status from Time 1 to Time 2.
  • The hope is that more students will have moved from non-mastery to mastery than from mastery to non-mastery.
  • Conduct a chi-square analysis to determine if the number of students moving in one direction is significantly greater than the number of students moving in the other direction.
To evaluate the educators’ effectiveness, the chi-square analysis yields the following outcomes:
  1. Expected growth is not maintained. This outcome is supported in those instances in which there is a significant decrease in the relative proportion of students achieving standards mastery.
  2. Expected growth is maintained. This outcome is supported in those instances in which there is no significant change.
  3. Expected growth is exceeded. This outcome is supported in those instances in which there is a significant increase in the relative proportion of students achieving standards mastery.
If you have any questions or would like to learn more, please contact your Field Services Coordinator at 1.877.442.5453 or email GalileoInfo@ati-online.com.

Monday, January 30, 2012

Student Assessment History

What is the easiest way to access all the assessment data for one of my students?

While Galileo provides users with many reports that may be run on individual students, the most popular and most inclusive of these reports is the Student Assessment History Report.

Where do I find the Assessment History report?
The Student Assessment History may be accessed from a number of places in the Galileo application. Generally teachers find it easiest to access the Assessment History from the Class Roster on the Dashboard page.


About Assessment History
The Assessment History Report displays assessment data for all the years and tests (benchmark, formative, and external) that the student has taken. It allows the teacher to see how students did on previous tests and to what degree they have mastered other grade-articulated standards. You may access the Individual Profile report and the Student Benchmark Profile page for the selected student.